My Charts Overview
All users with analytics access in Sospes can access the My Charts tool located under the Analytics tab.
Users will be able to create and save a wide variety of different charts specific to their needs. These charts can then be pinned to the the My Safety (homepage) giving each user a unique view each time they log in.
Each chart allows the customization of the following:
- Data Source: Select which module you would like your chart to pull data from.
- Chart Name: The title that will be displayed for the specific chart.
- Description: Optional - Note what data you are capturing and displaying in the chart.
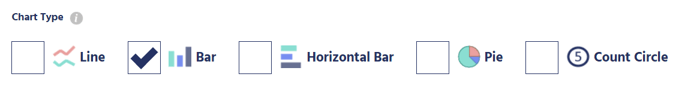
- Chart Type: Select what type of visualization you would like your chart to display. The options include line, bar, horizontal bar, pie, and count circle.
- Values: Select which values you would like to display on your chart. Bar and line charts will require an x-axis and y-axis value. Count circles and pie charts will require only one dimension.
- X-Axis: Choose which value you would like to display on the x-axis.
- Y-Axis: Choose which value(s) you would like to display on the y-axis.
- Dimension: Choose which value you would like to display on your count circle or pie chart.
- Filters: Select the time duration that you would like to filter your chart by, and add additional data filters based on previously chosen values.
- Time Filter: Choose the time period you would like your chart to display data.
- Data Filters: Add additional filters and/or select the "filter" icon to the right to further filter your previously chosen values.
How to use the My Charts Tool
Get started with the My Charts tool by watching this walkthrough instructional video!
How to Share My Charts
Users can share their custom-created charts with other users! Once a user has created a chart, they can share charts with individual users, user groups, or both! When shared, users will be notified via email and given instructions on adding the shared chart to their My Safety page.
Users also have the ability to remove a shared chart from a user's profile. To do this, the user would return to the Analytics page and edit the chart that was shared. From there, they would remove the user or user group from the list and click "Save".
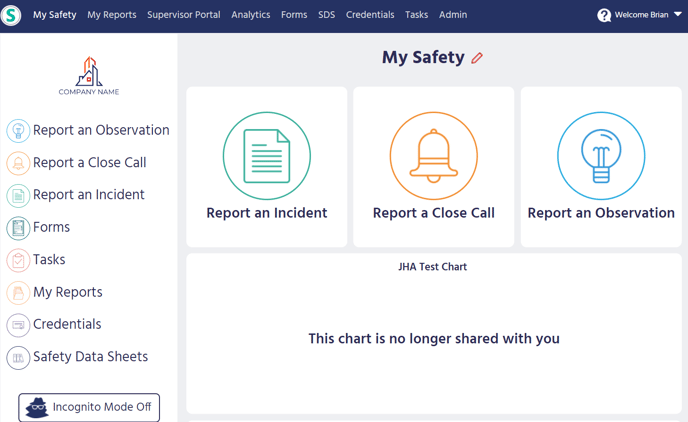
NOTE: If a chart has been unshared the user will see the following message where the chart was pinned on their My Safety page - This Chart is no longer shared with you.
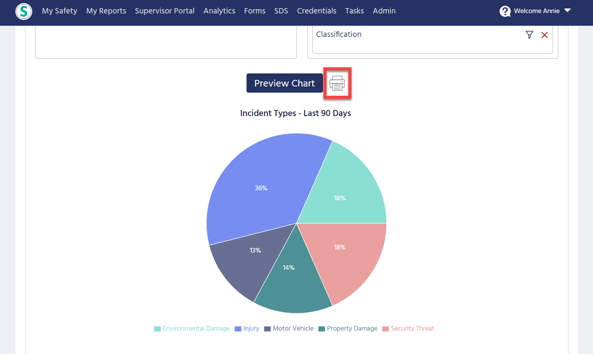
How to Print My Charts
In addition to pinning your customized charts to your My Safety page, users can also print their created charts to share with others! Once a user has created and saved their chart, they can click on the printer icon to print their chart. The printed chart will contain a title description, legend, and chart.